How to leverage Explainable Machine Learning
As Machine Learning and AI are becoming more and more popular an increasing number of organizations is adopting this new technology. Predictive modeling is helping processes becoming more efficient but also allow users to gain benefits. One can predict how much you are likely going to be earning based on your professional skills and experience. The output could simply be a number, but users typically want to know why that value is given!
In this article, I will demonstrate some methods for creating explainable predictions and guide you into opening these black-box models.
The data used in this article is the US Adult Income data set which is typically used to predict whether somebody makes less than 50K or more than 50, a simple binary classification task. You can get the data here or you can follow along with the notebook here.
The data is relatively straightforward with information with respect to an individuals’ Relationship, Occupation, Race, Gender, etc.

Modeling
The categorical variables are one-hot encoded and the target is set to either 0 (≤50K) or 1 (>50K). Now let’s say that we would like to use a model that is known for its great performance on classification tasks, but is highly complex and the output difficult to interpret. This model would be LightGBM which, together with CatBoost and XGBoost, is often used in both classification and regression tasks.
We start by simply fitting the model:
from lightgbm import LGBMClassifier
X = df[df.columns[1:]]
y = df[df.columns[0]]
clf = LGBMClassifier(random_state=0, n_estimators=100)
fitted_clf = clf.fit(X, y)
I should note that preferably you would have a train/test split with additional holdout data in order to prevent any overfitting you would do.
Next, I quickly check the performance of the model using 10-fold cross-validation:
from sklearn.model_selection import cross_val_score
scores_accuracy = cross_val_score(clf, X, y, cv=10)
scores_balanced = cross_val_score(clf, X, y, cv=10,
                                  scoring="balanced_accuracy")
Interestingly, scores_accuracy gives an average accuracy across 10-folds of 87% while scores_balanced gives 80%. As it turns out, the target variable is imbalanced with 25% of the target belonging to 1 and 75% to 0. Thus, choosing the correct validation measure is highly important as it may falsely indicate a good model.
Now that we have created the model, next would be explaining what it exactly has done. Since LightGBM works with highly efficient gradient boosting decision trees, interpretation of the output can be difficult.
Partial Dependency Plots (PDP)
Partial Dependency Plots (DPD) show the effect a feature has on the outcome of a predictive based model. It marginalizes the model output over the distribution of features in order to extract the importance of the feature of interest. The package, PDPbox, that I used can be found here.
Assumptions
This importance calculation is based on an important assumption, namely that the feature of interest is not correlated with all other features (except for the target). The reason for this is that it will show data points that are likely to be impossible. For example, weight and height are correlated but the PDP might show the effect of a large weight and very small height on the target while that combination is highly unlikely. This can be partially resolved by showing a rug at the bottom of your PDP.
Correlation
Thus, we check the correlation between features in order to make sure that there are no problems there:
import seaborn as sns
corr = raw_df.corr()
sns.heatmap(corr,
 xticklabels=corr.columns,
 yticklabels=corr.columns)

We can see that there is no strong correlation present among the features. However, I will do some one-hot encoding, later on, to prepare the data for modeling which could lead to the creation of correlated features.
Continuous variables
PDP plots can be used to visualize the impact of a variable on the output across all data points. Let’s first start with an obvious one, the effect of a continuous variable, namely capital_gain, on the target:
from pdpbox import pdp
pdp_fare = pdp.pdp_isolate(
    model=clf, dataset=df[df.columns[1:]], model_features=df.columns[1:], feature='Capital_gain'
)
fig, axes = pdp.pdp_plot(pdp_fare, 'Capital_gain', plot_pts_dist=True)

The x-axis shows the values capital_gain can take and the y-axis indicates the effect it can have on the probability of the binary classification. It is clear that as one’s capital_gain increases their chance of making <50K increases with it. Note, that the rug of data points at the bottom is helpful in identifying data points that do not appear often.
One-hot encoded variables
Now, what if you have categorical variables that you one-hot encoded? You would likely want to see the effect of the categories individually without having to plot them separately. With PDPbox you are able to show the effect on multiple binary categorical variables at the same time:
pdp_race = pdp.pdp_isolate(
    model=clf, dataset=df[df.columns[1:]],
    model_features=df.columns[1:],
    feature=[i for i in df.columns if 'O_' in i if i not in
                          ['O_ Adm-clerical',
                           'O_ Armed-Forces',
                           'O_ Armed-Forces',
                           'O_ Protective-serv',
                           'O_ Sales',
                           'O_ Handlers-cleaners']])
fig, axes = pdp.pdp_plot(pdp_race, 'Occupation', center=True,
                         plot_lines=True, frac_to_plot=100,
                         plot_pts_dist=True)

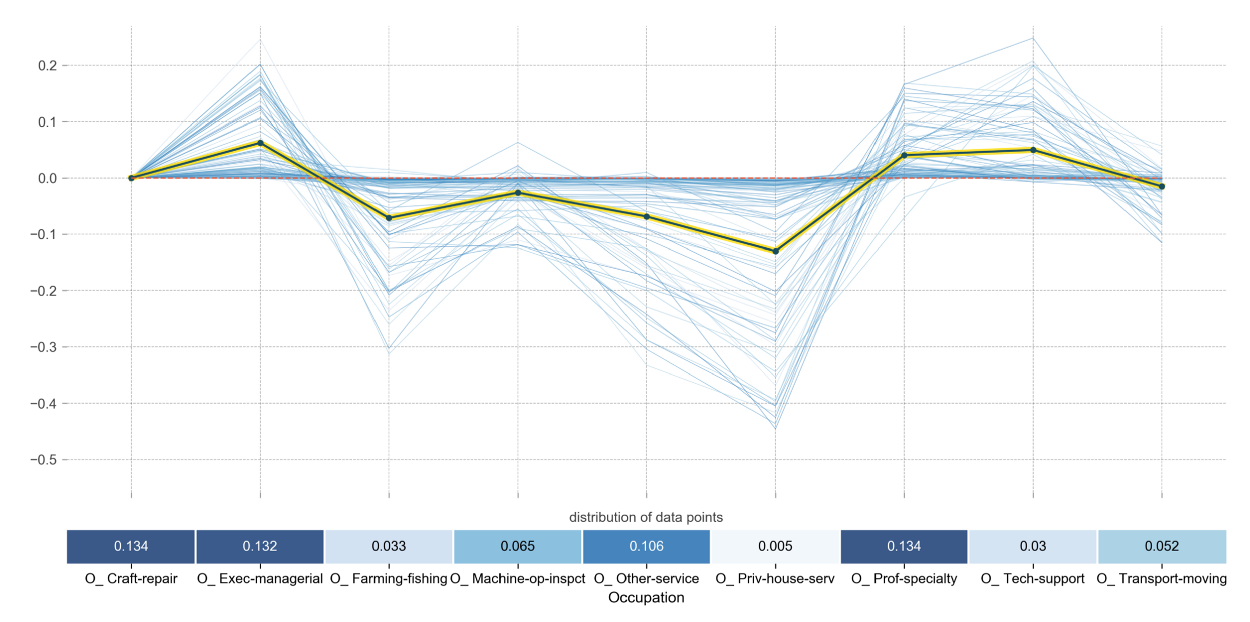
Here, you can clearly see that the likelihood of making more is positively affected by being either in a managerial position or that of technology. The chance decreases if you are working in the fishing industry.
Interaction between variables
Finally, the interaction between variables might be problematic as PDP will create values for the combination which are unlikely to be possible if the variables are highly correlated.
inter1 = pdp.pdp_interact(
    model=clf, dataset=df[df.columns[1:]],
    model_features=df.columns[1:], features=['Age', 'Hours/Week'])
fig, axes = pdp.pdp_interact_plot(
    pdp_interact_out=inter1, feature_names=['Age', 'Hours/Week'],
    plot_type='grid', x_quantile=True, plot_pdp=True)

This matrix tells you that an individual is likely to make more if they are around 49 years old and work roughly 50 hours a week. I should note that it is important to keep in mind the actual distribution of all interactions in your data set. There is a chance that this plot will show you interesting interactions that will rarely or never happen.
Local Interpretable Model-agnostic Explanations (LIME)
LIME basically tries to step away from deriving the importance of global features and instead approximates the importance of features for local predictions. It does so by taking the row (or set of data points) from which to predict and generate fake data based on that row. It then calculates the similarity between the fake data and the real data and approximates the effect of the changes based on the similarity between the fake and real data. The package that I used can be found here.
from lime.lime_tabular import LimeTabularExplainer
explainer = LimeTabularExplainer(X.values, feature_names=X.columns,
                                 class_names=["<=50K", ">50K"],
                                 discretize_continuous=True,
                                 kernel_width=5)
i = 304
exp = explainer.explain_instance(X.values[i], clf.predict_proba,
                                 num_features=5)
exp.show_in_notebook(show_table=True, show_all=False)

The output shows the effect of the top 5 variables on the prediction probability. This helps in identifying why your model makes a certain prediction but also allows for explanations to users.
Disadvantage
Note that the neighborhood (kernel width) around which LIME tries to find different values for the initial row is, to an extent, a hyperparameter that can be optimized. At times you want a larger neighborhood depending on the data. It is a bit of trial and error to find the right kernel width as it might hurt the interpretability of explanations.
SHapley Additive exPlanations (SHAP)
A (fairly) recent development has been the implementation of Shapley values into machine learning applications. In its essence, SHAP uses game theory to track the marginal contributions of each variable. For each variable, it randomly samples other values from the data set and calculates the change in your model score. These changes are then averaged for each variable to create a summary score, but also gives information on how important certain variables are for a specific data point.
Click here for the package that I used in the analyses. For a more in-depth explanation of the theoretical background of SHAP click here.
Three axioms of interpretability
SHAP has been well-received due to its ability to satisfy the three axioms of interpretability:
- Any feature that has no effect on the predicted value should have a Shapley value of 0 (Dummy)
- If two features add the same value to the prediction, then their Shapley values should be the same (Substitutability)
- If you have two or more predictions that you would want to merge you should be able to simply add the Shapley values that were calculated on the individual predictions (Additivity)
Binary Classification
Let’s see what the result would be if we were to calculate the Shapley values for a single row:
import shap
explainer = shap.TreeExplainer(clf)
shap_values = explainer.shap_values(X)
shap.initjs()
shap.force_plot(explainer.expected_value, shap_values[1,:],
                X.iloc[1,:])

This plot shows a base value that is used to indicate the direction of the prediction. Seeing as most of the targets are 0 it isn’t strange to see that the base value is negative.
The red bar shows how much the probability that the target is 1 (>50K) is increased if its Education_num is 13. Higher education typically leads to making more.
The blue bars show that these variables decrease the probability, with Age having the biggest effect. This makes sense as younger people typically make less.
Regression
Shapley works intuitively a bit better when it concerns regression (continuous variable) rather than binary classification. Just to show an example, let’s train a model to predict age from the same data set:
# Fit model with target Age
X = df[df.columns[2:]]
y = df[df.columns[1]]
clf = LGBMRegressor(random_state=0, n_estimators=100)
fitted_clf = clf.fit(X, y)
# Create Shapley plot for one row
explainer = shap.TreeExplainer(clf)
shap_values = explainer.shap_values(X)
shap.initjs()
i=200
shap.force_plot(explainer.expected_value, shap_values[i,:], X.iloc[i,:])

Here, you can quickly observe that if you are never married the predicted Age is lowered by roughly 8 years. This helps a bit more with explaining the prediction compared to a classification task since you are directly talking about the value of the target instead of its probability.
One-hot encoded features
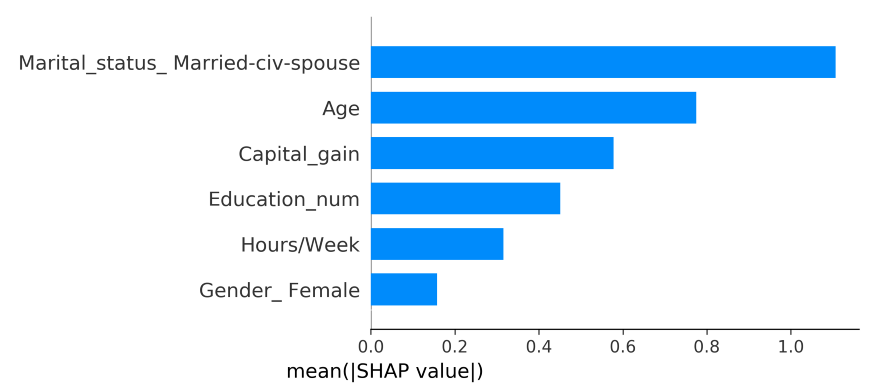
The Additivity axiom allows for summing Shapley values for each feature over all data points in order to create the mean absolute Shapley value. In other words, it gives global feature importances:
shap.summary_plot(shap_values, X, plot_type="bar", show=False)

However, you can immediately see the problem using Shapley values for one-hot encoded features, they are shown for each one-hot encoded feature instead of what they originally represented.
Fortunately, the Additivity axiom allows the Shapley values for each one-hot encoded generated feature to be summed as a representation of the Shapley value for the entire feature.
First, we need to sum up all the Shapley values for the one-hot encoded features:
summary_df = pd.DataFrame([X.columns,
                           abs(shap_values).mean(axis=0)]).T
summary_df.columns = ['Feature', 'mean_SHAP']
mapping = {}
for feature in summary_df.Feature.values:
    mapping[feature] = feature
for prefix, alternative in zip(['Workclass', 'Education',
                                    'Marital_status', 'O_',
                                    'Relationship', 'Gender',
                                    'Native_country', 'Capital',
                                    'Race'],
                                   ['Workclass', 'Education',
                                    'Marital_status', 'Occupation',
                                    'Relationship', 'Gender',
                                    'Country', 'Capital', 'Race']):
        if feature.startswith(prefix):
            mapping[feature] = alternative
            break

summary_df['Feature'] = summary_df.Feature.map(mapping)
shap_df = (summary_df.groupby('Feature')
                    .sum()
                    .sort_values("mean_SHAP", ascending=False)
                    .reset_index())
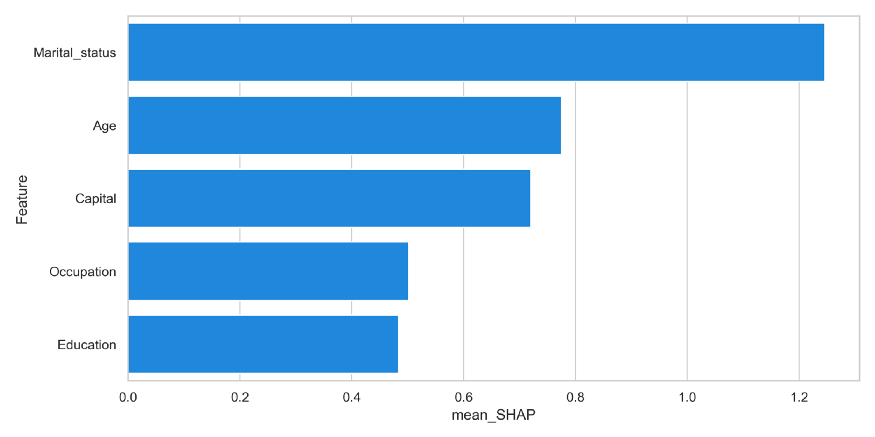
Now that all the Shapley values are average across all features and summed for the one-hot encoded features we can plot the resulting feature importance:
import seaborn as sns
import matplotlib.pyplot as plt
sns.set(style="whitegrid")
f, ax = plt.subplots(figsize=(6, 15))
sns.barplot(x="mean_SHAP", y="Feature", data=shap_df[:5],
            label="Total", color="b")

We can now see that Occupation is way more important than the original Shapley summary plot showed. Thus, make sure to use the Additivity to your advantage when explaining the importance of features to your users. They are likely to be more interested in how important Occupation is rather than a specific Occupation.
Conclusion
Although this is definitely not the first article to talk about Interpretable and Explainable ML, I hope this helped you understand how these technologies can be used when developing your model.
There has been a significant buzz around SHAP and I hope that demonstrating the Additivity axiom using one-hot encoded features gives more intuition on how to use such a method.